|
Pisum Genetics |
Volume 25 |
1993 |
Research Reports |
pages 5-12 |
On the pea linkage map
|
Ellis, T.H.N., Hellens, R.P., Turner, L., Lee, C, Domoney, C. and Welham, T. |
John Innes Institute Colney Lane, Norwich NR4 7UH , UK |
In the previous issue of Pisum Genetics (2), comments were made concerning difficulties in the interpretation of an RFLP map (1) of pea presented from this laboratory. The main problem concerns 'consistency' of the linkage map and leaves unresolved the question of whether patterns of linkage association are generally conserved within this species. We emphasised the variability in the linkage associations which we observed, and this was the main general biological point we wished to make. However, this emphasis may have detracted from the more specialist aim of developing a workable linkage map for pea. The purpose of this article is to simplify this process.
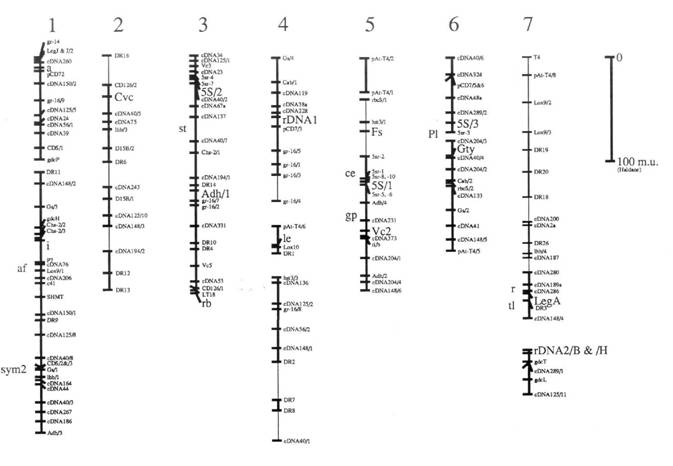
Here we present an update (Fig. 1) of the linkage map derived from one of our pea recombinant inbred populations (JI281 x JI399). This map is redrawn (from ref. 1) with the addition of a few extra markers, and some small alterations to the local order of a few markers. Details of all the markers are given in Table 1. In addition to these minor changes, the map as drawn has some major differences which are itemised below.
1. The presumed translocation involving groups 1 and 4 has been broken into its constituent parts, and is not drawn as a single group. In addition, three markers have been removed and placed next to a glutamine synthase gene on group 6. This alteration removes one association 'between linkage groups' discussed in ref. 1.
2. The linkage segment including Gty was previously part of group 5 (1) and is now drawn as a separate linkage group and is assigned to group 6 in agreement with the conventional map position of Gty (5) and because of a loose association between the two parts of group 6.
3. Markers near a on group 1 and those near to the locus detected by cDNA 2a on group 7 have been reordered in recognition of the association between DR 18 and markers on group 1 near a and markers on group 7. This 1/7 association was discussed briefly in Ellis et al. (1) and will be discussed more fully elsewhere.
4. The linkage segment from hst3/3 to cDNA 40/1 is assigned to group 4 on account of the association between cDNA 136 and other markers from this segment in another cross. In the JI15 x JI61 recombinant inbred population the markers linked to cDNA 136 include a Gs and Cab locus.
5. Classical markers known from other recombinant inbred populations to be tightly linked to RFLPs placed on this map are given an approximate location to the left of their respective groups.
6. The thick lines designate linkages supported by a LOD score greater than or equal to 3.0. The thin lines are linkages with less support presented previously (1).
The relationship between this map and the standard genetic map [Weeden and Wolko (5) and the Linkage Map Committee (3)] can be established for each of the major linkage segments of Fig. 1 because each of these segments carries one or more markers placed on the standard map. Markers which can be used to relate Fig. 1 to the standard map are listed in Table 1. The agreement is reasonably good with the notable exception of group 7. This difference is discussed in Ellis et al. (1) and below in conjunction with glutamine synthase genes.
The Gs/Lhb/sym2 association on this map is in agreement with Weeden et al. (4), but this Gs marker (called Gse in ref. 4) does not appear to correspond to any of the four Gs loci on the standard map (5). The association between a Gs and Cab gene on group 4 of this map may be a confirmation of the Gs-n1 (=GS341)/Cab association of the standard map. The former shows an association with rDNAl and the latter with Rrn2. This may imply that our previous tentative suggestion that rDNAl corresponds to Rrn1 was unfounded; the direct connection between rDNAl and le has been broken in this redrawn map, in part due to the relocation of the markers mentioned in item 1) above. The linkage data on which this connection was based can be found in ref. 1. The uppermost linkage segment in the group 4 as drawn in Fig. 1 may therefore correspond to group 7 of the standard map (5). The associations between linkage segments are not shown on this map, but the data corresponding to these and especially in relation to the differences between the two versions of the linkage map from this one cross can be found in Ellis et al. (1).
Fig. 1 shows an RFLP map derived largely from the analysis of the recombinant inbred population JI281 x JI399 as discussed in the text. Marker names are as in ref. 1, with the following exceptions. The markers detected with a glutamine synthase gene probe are written as Gs/x where they were previously written as GST-10/x; this is to avoid confusion with glutathione-S-transferase. The glycine decarboxylase genes are designated gdc rather than by the plasmid names pST. Similarly, Adh genes are designated Adh/x where they were previously designated pPSR 546/x. The lipoxygenase genes are designated Lox9/x, corresponding to pPE 923/x, and Lox10 corresponding to pPE1036a. The markers designated 0.9 MI/x have been shown to correspond to Cab genes and are designated Cab/x. The rDNA locus referred to as rDNAl was previously designated by the probe name cDB107. The marker Fs was previously regarded as F. These alterations have been made to facilitate comparison to the map of Weeden and Wolko (5).
Table 1. Explanation of marker names in Fig. 1.
|
|
Marker (Fig. 1) |
Marker (in 5) |
Comments |
|
|
Group 1 (upper) |
|
|
|
1. |
gr-14 |
|
glutathione reductase |
|
2. |
LgJ |
Lg-J |
B-type legumin gene cluster. NOT Lg2 of Matta |
|
3. |
LgJ/2 |
|
and Gatehouse (see 1) LgJ/2 is adjacent seq. |
|
4. |
cDNA 260 |
|
|
|
5. |
a |
a |
lacking anthocyanin |
|
6. |
pCD 72 |
|
vicilin |
|
7. |
cDNA 150/2 |
|
|
|
8. |
gr-16/9 |
|
|
|
9. |
cDNA 125/5 |
|
|
|
10. |
cDNA 24 |
|
|
|
11. |
CDNA56/1 |
|
|
|
12. |
cDNA 39 |
|
|
|
13. |
CDS/1 |
|
|
|
14. |
gdcP |
|
glycine decarboxylase, previously pST P |
|
|
Group 1 (lower) |
|
|
|
15. |
DR 11 |
|
copia-like element |
|
16. |
cDNA 148/2 |
|
|
|
17. |
Gs/3 |
|
Glutamine synthase |
|
18. |
gdcH |
|
glycine decarboxylase, previously pST H |
|
19. |
Chs-2/2 |
|
The major chalcone synthase gene cluster with |
|
20. |
Chs-2/3 |
|
recombination within the Chs gene cluster. |
|
21. |
i |
i |
green cotyledons |
|
22. |
P7 |
|
seed polypeptide |
|
23. |
cDNA 76 |
|
|
|
24. |
Lox9/1 |
linked to af |
lipoxygenase, previously pPE 923/1 |
|
25. |
cDNA 206 |
|
|
|
26. |
c41 |
|
tandem repeat in situ marker |
|
27. |
SHMT |
|
serine hydroxymethyl transferase |
|
28. |
cDNA 150/1 |
|
|
|
29. |
DR 9 |
|
copia-like element |
|
30. |
cDNA 125/8 |
|
|
|
31. |
CDNA40/8 |
|
|
|
32. |
CDS/3 |
|
|
|
33. |
CDS/2 |
|
|
|
34. |
Gs/1 |
? Gse |
glutamine synthase } Sym2 associated � |
|
35. |
lhb/1 |
|
leghaemoglobin } Sym2 associated � |
|
36. |
cDNA 164 |
|
|
|
37. |
cDNA 44 |
|
|
|
38. |
cDNA 40/3 |
|
|
|
39. |
cDNA 267 |
|
|
|
40. |
cDNA 186 |
|
|
|
41. |
Adh/3 |
|
Alcohol dehydrogenase |
|
|
Group 2 |
|
|
|
42. |
DR 16 |
|
copia-like element |
|
43. |
CD126/2 |
|
|
|
44. |
Cvc |
Cvc |
Convicilin |
|
45. |
cDNA 40/5 |
|
|
|
46. |
cDNA 75 |
|
|
|
47. |
lhb/3 |
|
leghaemoglobin |
|
48. |
D15B/2 |
|
|
|
49. |
DR 6 |
|
copia-like element |
|
50. |
cDNA 243 |
|
|
|
51. |
D15B/1 |
|
|
|
52. |
cDNA 125/10 |
|
|
|
53. |
cDNA 148/3 |
|
|
|
54. |
cDNA 194/2 |
|
|
|
55. |
DR 12 |
|
copia-like element |
|
56. |
DR 13 |
|
copia-like element |
|
|
Group 3 |
|
|
|
57. |
cDNA 34 |
|
|
|
58. |
cDNA 125/1 |
|
|
|
59. |
cDNA 23 |
|
|
|
60. |
Vc-3 |
|
Vicilin |
|
61. |
5sr-7 |
|
5S rRNA related sequence |
|
62. |
5sr-4 |
|
5S rRNA related sequence |
|
63. |
5S/2 |
|
5S rRNA gene cluster |
|
64. |
cDNA 40/2 |
|
|
|
65. |
cDNA 67a |
|
|
|
66. |
cDNA 137 |
linked to st |
|
|
67. |
cDNA 40/7 |
|
|
|
68. |
Chs-2/1 |
|
Chalcone synthase gene responsive to a |
|
69. |
cDNA 194/1 |
|
|
|
70. |
DR 14 |
|
copia-like element |
|
71. |
Adh/1 |
|
Alcohol dehydrogenase (major signal) |
|
72. |
gr-16/7 |
|
|
|
73. |
gr-16/2 |
|
|
|
74. |
cDNA 331 |
|
|
|
75. |
DR 10 |
|
copia-like element |
|
76. |
DR 4 |
|
copia-like element |
|
77. |
Vc-5 |
|
|
|
78. |
cDNA 53 |
|
|
|
79. |
CD 126/1 |
|
|
|
80. |
LT18 |
|
legumin gene related sequence |
|
81. |
rb |
rb |
wrinkled seed |
|
|
Group 4 (top) |
|
|
|
82. |
Gs/4 |
? Gs-n1 |
glutamine synthase |
|
83. |
Cab/1 |
? Cab |
chlorophyll a/b binding protein related sequence |
|
84. |
cDNA 119 |
|
|
|
85. |
cDNA 38a |
|
|
|
86. |
cDNA 228 |
|
|
|
87. |
rDNAl |
Rrn1 or Rrn2 |
large rRNA gene cluster |
|
88. |
CD7/3 |
|
|
|
89. |
gr-16/5 |
|
|
|
90. |
gr-16/1 |
|
|
|
91. |
gr-16/3 |
|
|
|
92. |
gr-16/4 |
|
|
|
|
Group 4 (middle) |
|
|
|
93. |
pAt-T4/6 |
|
telomere related sequence |
|
94. |
le |
le |
short intemodes |
|
95. |
Lox10 |
Lox |
lipoxygenase |
|
96. |
DR 1 |
|
copia-like element |
|
|
Group 4 (bottom) |
|
|
|
97. |
hst3/3 |
|
Histone H3 related DNA sequence |
|
98. |
cDNA 136 |
|
|
|
99. |
cDNA 125/2 |
|
|
|
100. |
gr-16/8 |
|
|
|
101. |
cDNA 56/2 |
|
|
|
102. |
cDNA 148/1 |
|
|
|
103. |
DR 2, |
|
copia-like element |
|
104. |
DR 7, |
|
copia-like element |
|
105. |
DR 8 |
|
copia-like element |
|
106. |
cDNA 40/1 |
|
|
|
|
Group 5 (top) |
|
|
|
107. |
pAt-T4/2 |
|
telomere related sequence |
|
108. |
pAt-T4/l |
|
telomere related sequence |
|
|
Group 5 (bottom) |
|
|
|
109. |
rbcS/1 |
RbcS |
RUBP carboxylase |
|
110. |
hst3/l |
|
Histone H3 related DNA sequence |
|
111. |
Fs |
Fs |
violet speckles on testa |
|
112. |
5sr-2 |
|
5S rRNA related sequence |
|
113. |
5S/1 |
linked to ce |
5S gene cluster |
|
114. |
5sr-6 |
|
|
|
115. |
5sr-l |
|
|
|
116. |
5sr-5 |
|
|
|
117. |
5sr-10 |
|
|
|
118. |
Adh/4 |
|
Alcohol dehydrogenasc |
|
119. |
cDNA 231 |
linked to gp |
|
|
120. |
ti/b |
linked to gp |
trypsin inhibitor |
|
121. |
Vc-2 |
linked to gp |
vicilin |
|
122. |
cDNA 373 |
|
|
|
123. |
cDNA 204/1 |
|
|
|
124. |
Adh/2 |
|
Alcohol dehydrogenase |
|
125. |
cDNA 204/4 |
|
|
|
126. |
cDNA 148/6 |
|
|
|
|
Group 6 (upper) |
|
|
|
127. |
cDNA 40/6 |
|
|
|
128. |
cDNA 324 |
|
|
|
129. |
pCD7/5&6 |
|
previously 2 markers � |
|
130. |
cDNA 48a |
|
|
|
131. |
cDNA 289/2 |
|
|
|
132. |
5S/3 |
linked to Pl |
5S gene cluster |
|
133. |
5sr-3 |
|
5S rRNA related sequence |
|
|
Group 6 (lower) |
|
|
|
134. |
cDNA 204/3 |
|
|
|
135. |
Gty |
Gty |
gritty testa |
|
136. |
CDNA40/4 |
|
|
|
137. |
cDNA 204/2 |
|
|
|
138. |
Cab/2 |
|
chlorophyll a/b binding protein related sequence |
|
139. |
rbcS/2 |
|
RUBP carboxylase |
|
140. |
cDNA 133 |
|
|
|
141. |
Gs/2 |
|
glutamine synthase |
|
142. |
cDNA 41 |
|
|
|
143. |
cDNA 148/5 |
|
|
|
144. |
pAt-T4/5 |
|
telomere related sequence |
|
|
Group 7 (upper) |
|
|
|
145. |
T4 |
|
microsatellite adjacent to telomere sequence |
|
146. |
pAt-T4/8 |
|
telomere related sequence |
|
147. |
Lox9/2 |
|
lipoxygenase |
|
148. |
Lox9/3 |
|
lipoxygenase |
|
149. |
DR 19 |
|
copia-like element |
|
150. |
DR 20 |
|
copia-like element |
|
151. |
DR 18 |
|
copia-like element |
|
152. |
cDNA 200 |
|
|
|
153. |
cDNA 2a |
linked to r |
|
|
154. |
DR 26 |
|
copia-like element |
|
155. |
lhb/4 |
|
leghaemoglobin |
|
156. |
cDNA 189a |
|
|
|
157. |
cDNA 280 |
linked to r |
|
|
158. |
cDNA 189a |
|
|
|
159. |
cDNA 286 |
|
|
|
160. |
Lg-1 |
Lg-1 |
A-type legumin |
|
161. |
DR 3 |
|
copia-like element |
|
162. |
cDNA 148/4 |
|
|
|
|
Group 7 (lower) |
|
|
|
163. |
rDNA2/B |
Rrn1 or Rrn2 |
large ribosomal RNA gene cluster, |
|
164. |
rDNA2/H |
Rrn1 or Rrn2 |
recombination within the array |
|
165. |
gdcT |
|
glycine decarboxylase, previously pST T |
|
166. |
cDNA 289/1 |
|
|
|
167. |
gdcL |
|
glycine decarboxylase, previously pST L |
|
168. |
cDNA 125/11 |
|
|
� pCD7/5 and pCD7/6 could be mapped as two markers, but all the lines carrying the JI399 allele of 7/6 carry the JI399 allele of 7/5. This and the relatedness of the DNA sequences has led us to treat this probe as detecting a single marker for the purposes of the present map. This is essentially the pCD7/5 marker of ref 1. � T. Bisseling pers. comm.
This map is an attempt to make sense of the patterns of segregation of markers in a recombinant inbred population. The difficulties in relating this map to the standard map should not be taken to imply that either is wrong. Some of the difficulties are probably a consequence of working with different data sets, but the more interesting possibility that the difficulties arise from the variability of the pea genome seem well worth further study. Furthermore, the segregation data for recombinant inbred populations can be built upon with additional molecular markers and with the analysis of phenotypic traits. The population from which this map was derived (and our other recombinant inbred populations) are sets of multiply marked genetic stocks, with attendant and interrelated segregation data. At present, the JI281 x JI399 recombinant inbred population is at the F12 generation. This population is generally available for further genetic analysis, subject only to limitations of seed number and import or export controls.
1. Ellis, T.H.N., Turner,
L., Hellens, R.P., Lee, D., Harker, C.L., Enard, C,
Domoney, C. and Davies, D.R. 1992. Genetics
130:649-663.
2. Weeden, N.F. 1992. Pisum Genetics 24:91.
3.
Weeden, N.F., Ambrose,
M. and Swiecicki, W.K. 1991. Pisum Genetics 23:
Cover.
4.
Weeden, N.F., Kneen, B.E. and
LaRue, T.A. 1990. In: Nitrogen Fixation:
Achievements and Objectives, Eds P.M. Gresshoff,
J. Roth, G. Stacey and
W.E. Newton, Chapman and Hall, New York, pp.
323-330.
5.
Weeden, N.F. and Wolko, B. 1990. In:
Genetic Maps, 5th edition, Ed. S.J.
O'Brien, Cold Spring Harbor
Press, Cold Spring Harbor, N.Y., pp. 6 .106-6.112.