|
PNL |
Volume 22 |
1990 |
RESEARCH REPORTS |
pages 75-77 |
TWO NEW ISOZYME LOCI ON CHROMOSOME 2
|
Wolko, B.
and N.F. Weeden
|
Plant Breeding Station, Wiatrowo 62100 Wagrowiec, Poland Dept. of Hort. Sci., NYSAES Geneva, NY 14456, USA |
There are few convenient markers on the section of chromosome 2 distal to Pgm-p and K. Pal is available but requires a recessive z background for clearest expression. Other genes such as beg, fn, den, and str, are difficult to work with because they also require specific genetic backgrounds for expression or have low penetrance. Isozymes usually are not affected by gene expression at other loci and, thus, can make excellent molecular tags for specific regions of the genome. Here we report the mapping of two isozyme loci to this region of chromosome 2.
The parental lines used in the crosses were obtained from the same sources as those in (3). Extracts from young leaf tissue were obtained and subjected to horizontal starch gel electrophoresis as described in (1). The gel system and assay conditions for diaphorase (DIA, EC 1.6.4.-) have been described previously (2). Fumarase (FUM, EC 4.2.1.2) was resolved on the cathodal slice of a morpholine/citrate gel (1). The assay mixture contained 0.1 M potassium phosphate (pH 7.5), 0.1 M sodium fumarate (pH 7.5), 0.5 mM NAD, 0.4 mM MTT, 0.1 mM PMS, and 10 units/ml malate dehydrogenase.
We have described the DIA phenotype for pea in an earlier publication (2). A rare DIA-3 variant was found in accessions PI227258 and PI220189. In these lines the DIA-3 band migrated slightly faster than the common variant. The F2 progeny derived from crosses between lines with alternate DIA-3 phenotypes usually segregated in a 1:2:1 ratio (Table 1), indicating monogenic control and codominant expression.
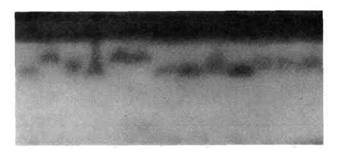
The FUM phenotypes segregating in an F2 progeny are shown in Fig. 1. A single cathodal band was observed in inbred lines. The hybrid phenotype consisted of a broad smear of activity with the individual bands poorly resolved. At least five bands were present in the hybrid phenotype, implying that the enzyme is at least a tetramer. As was the case for DIA-3, the FUM phenotypes generally displayed monogenic inheritance (Table 1). The loci responsible for producing the polymorphism in DIA-3 and FUM are designated Dia-3 and Fum, respectively.
Fig. 1. Segregation of fumarase phenotypes in an F2 progeny. First two lanes from left depict parental phenotypes. Third lane from left shows the hybrid (heterozygous) phenotype. Origin is at top of figure, cathode is at bottom.
Joint segregation analysis of Fum and markers on chromosome 2 revealed non-random assortment with Pgm-p in several crosses (Table 2). Although the linkage was not particularly close, its reproducibility was excellent, Homogeneity tests indicated that the data from the several crosses could be combined to give a better estimate of the recombination frequencies among the various loci. The combined data are presented in the last section of Table 2. All joint segregation chi-square values for the combined data are significant at P<0.0001. We conclude that Fum is located approximately 24 map units from Pgm-p and place it on the side opposite K and Wb (see below) because no linkage was observed between either S or K and Fum in the progeny from the cross Slow x С385-240. Dia-3 is another 20 map units from Fum, distal to Pgm-p. Only very weak linkage was observed between Pgm-p and Dia-3 (Table 2).
Partial map of chromosome 2:
S---10---Wb---10---K--3--Pgm-p------24------Fum------20------Dia-3
Table 1. Single locus segregation of loci on chromosome 2.
|
Cross |
Locus |
N |
Phenotype1 |
Ratio |
|
||
|
aa |
ab |
bb |
|||||
|
JI12 x 227258 |
Dia-3 |
44 |
11 |
14 |
19 |
1:2:1 |
8.72* |
|
|
Fum |
44 |
19 |
16 |
9 |
1:2:1 |
7.82* |
|
|
Pgm-p |
44 |
9 |
28 |
7 |
1:2:1 |
3.46 |
|
227258 x 169607 |
Dia-3 |
51 |
8 |
27 |
16 |
1:2:1 |
2.69 |
|
|
Furn |
51 |
24 |
21 |
6 |
1:2:1 |
14.29* |
|
|
Pgm-p |
51 |
ie |
23 |
18 |
1:2:1 |
3.00 |
|
Slow x 277258 |
Dia-3 |
24 |
7 |
9 |
8 |
1:2:1 |
1.58 |
|
|
Fum |
24 |
5 |
15 |
4 |
1:2:1 |
1.58 |
|
A73-91 x 227258 |
Dia-3 |
27 |
5 |
13 |
9 |
1:2:1 |
1.22 |
|
|
Fum |
27 |
8 |
15 |
4 |
1:2:1 |
1.52 |
|
|
Pgm-p |
27 |
5 |
16 |
6 |
1:2:1 |
1.00 |
|
Slow x 220189 |
Dia-3 |
26 |
7 |
12 |
7 |
1:2:1 |
0.15 |
|
|
Fum |
26 |
10 |
10 |
6 |
1:2:1 |
2.62 |
|
Slow x C385-240 |
S |
38 |
34 |
-- |
4 |
3:1 |
4.24* |
|
|
K |
51 |
40 |
-- |
11 |
3:1 |
0.57 |
|
|
Pgm-p |
48 |
8 |
28 |
12 |
1:2:1 |
2.00 |
|
|
Fum |
51 |
6 |
15 |
11 |
1:2:1 |
1.69 |
1aa = dominant or homozygous fast, ab = heterozygous, bb = recessive or homozygous slow.
*Indicates deviation from expected ratio was significant at P<0.05.
Table 2. Joint segregation analysis of loci on chromosome 2.
|
Cross |
Number of progeny with designated phenotype1 |
c2 |
Rec. frac. |
SE |
||||||||
|
Loci |
a/a |
a/h |
a/b |
h/a |
h/h |
h/b |
b/a |
b/h |
b/b |
|||
|
JI12 x 227258 |
|
|
|
|
|
|
|
|
|
|
|
|
|
Pgm-p:Fum |
1 |
0 |
8P |
14 |
13 |
1 |
4P |
3 |
0 |
32.8 |
26 |
5.6 |
|
Pgm-p:Dia-3 |
6P |
2 |
1 |
5 |
8 |
15 |
0 |
4 |
3P |
13.2 |
36 |
6.8 |
|
Dia-3:Fum |
1 |
6 |
12P |
3 |
6 |
7 |
7P |
2 |
0 |
19.3 |
24 |
5.4 |
|
227258 x 169607 |
|
|
|
|
|
|
|
|
|
|
|
|
|
Pgm-с:Fum |
1 |
4 |
5P |
9 |
14 |
0 |
14P |
3 |
1 |
27.3 |
22 |
4.8 |
|
Pgm-c: Dia-3 |
5P |
5 |
0 |
2 |
15 |
6 |
7 |
1 |
10P |
17.4 |
24 |
5.0 |
|
Dia-3:Fum |
0 |
9 |
15P |
4 |
16 |
1 |
4P |
2 |
0 |
31.6 |
17 |
4.2 |
|
Slow x 227258 |
|
|
|
|
|
|
|
|
|
|
|
|
|
Dia-3:Fum |
0 |
2 |
3P |
3 |
7 |
5 |
4P |
0 |
0 |
13.0 |
23 |
7.1 |
|
A73-91 x 227258 |
|
|
|
|
|
|
|
|
|
|
|
|
|
Pgm-c:Dia-3 |
1P |
1 |
3 |
4 |
11 |
1 |
0 |
1 |
5P |
14.0 |
31 |
8.0 |
|
Pgm-c: Fum |
2 |
1 |
2P |
1 |
13 |
2 |
5P |
1 |
0 |
16.7 |
19 |
6.1 |
|
Dia-3:Fum |
0 |
3 |
2P |
2 |
10 |
1 |
6P |
2 |
1 |
12.1 |
21 |
6.4 |
|
Slow x 220189 |
|
|
|
|
|
|
|
|
|
|
|
|
|
Dia-3:Fum |
1 |
1 |
5P |
3 |
8 |
1 |
6P |
1 |
0 |
20.1 |
17 |
5.8 |
|
Slow x C385-240 |
|
|
|
|
|
|
|
|
|
|
|
|
|
K:S |
29P |
|
2 |
|
|
|
4 |
|
2P |
3.8 |
23 |
15 |
|
К:Pgm-p |
8P |
25 |
1 |
|
|
|
0 |
1 |
10P |
34.9 |
4 |
3 |
|
Pgm-p:Fum |
0 |
4 |
4P |
7 |
15 |
4 |
6P |
5 |
0 |
11.8 |
26 |
6 |
|
Combined data |
|
|
|
|
|
|
|
|
|
|
|
|
|
Pgm-p:Fum |
4 |
9 |
19 |
31 |
55 |
7 |
29 |
12 |
1 |
71.3 |
24 |
3 |
|
Pgm-p:Dia-3 |
12 |
8 |
4 |
11 |
34 |
22 |
7 |
6 |
18 |
20.6 |
34 |
4 |
|
Dia-3:Fum |
2 |
21 |
37 |
15 |
47 |
15 |
27 |
7 |
1 |
90.6 |
20 |
2 |
1a = dominant or homozygous fast, h = heterozygous, b = recessive or homozygous slow.
P Indicates parental genotypes.
Weeden, N.F. and G.A. Marx. 1984. J. Hered. 75:365-370.
Wolko, B. and N.F. Weeden. 1988. PNL 20:52-53.
Wolko, B. and N.F. Weeden. 1990. PNL 22:71-74.