PNL Volume 19 1987 RESEARCH REPORTS 31
DETERMINATE GROWTH HABIT (det) IN PEAS: ISOLATION,
SYMBOLIZATION,
AND LINKAGE
AND LINKAGE
Makasheva, R. Kh. N. I. Vavilov Institute of Plant
Industry
and A.. M. Drozd Leningrad, USSR
More than 26 genes are known to
control stem characters in
peas, a considerable number of which have implications for
breeding. A mutant conferring a true determinate growth habit was
isolated after chemical mutagenesis and described in 1975 by
Popova (2). Popova's mutant regularly developed two reproductive
nodes, each with a maximum of two flowers and pods, at the top of
the stem.
Segregating populations indicated
that the determinate habit
has recessive monogenic inheritance (Table 1), and the gene con-
trolling this character was previously designated as det (3).
has recessive monogenic inheritance (Table 1), and the gene con-
trolling this character was previously designated as det (3).
An analysis to determine the
localization of the new gene was
performed on data from four crosses. Evidence of linkage between
Tl and Det is shown in Table 2.
performed on data from four crosses. Evidence of linkage between
Tl and Det is shown in Table 2.
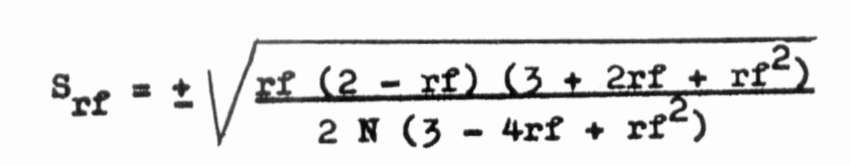
Estimates of linkage (Rf)
intensity were calculated using the
formula:
formula:
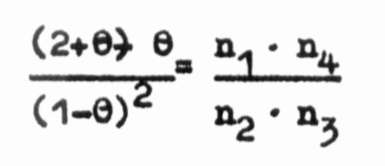
where rq...^ are the observed
frequencies of the XY, Xy, xY,
and xy classes. Linkage in repulsion is shown by 9=rf2 and in
coupling by 9=(l-rf)2. Error estimate was calculated by the
formula:
and xy classes. Linkage in repulsion is shown by 9=rf2 and in
coupling by 9=(l-rf)2. Error estimate was calculated by the
formula:
Estimates of linkage intensity in
four crosses (Table 2)
were: 0.12, 0.07, 0.14, and 0.18, with an average of 11.1 + 1.1%.
were: 0.12, 0.07, 0.14, and 0.18, with an average of 11.1 + 1.1%.
Our results reveal that gene
Det-det is located in linkage
group 7 at a distance of 11.1% from Tl tl.
group 7 at a distance of 11.1% from Tl tl.
Offspring from separate crosses
segregating for smooth (R)
and wrinkled (r_) seeds confirmed the existence of strong linkage
between _r and det alleles reported by Marx (1); we found no plants
with determinate growth habit among the R offspring.
and wrinkled (r_) seeds confirmed the existence of strong linkage
between _r and det alleles reported by Marx (1); we found no plants
with determinate growth habit among the R offspring.
1. Marx, G. A. 1986. PNL
18:45-48.
2. Popova, I. A. 1975. Trudy po seleccii i
semenowodstwu
owoshchnykh cultur VNIISSOC 3:66-72.
owoshchnykh cultur VNIISSOC 3:66-72.
3. Volchkov, Yu. A. 1986. Sbornic nauchnykh trudov
po
pricladnoj botanike, genetike i selectii 101:46-48.
pricladnoj botanike, genetike i selectii 101:46-48.